미국 상무부 2분기 성장률 -0.9% ,1분기 -1.6% 이어 2분기 연속 마이너스
 이미지 확대보기
28일 뉴욕증시에 따르면 미국 상무부는 한국시간 이날 밤 미국의 2분기 국내총생산(GDP) 속보치를 내놨다. 2분기 GDP 성장률은 -0.9%이다. 2분기 연속 마이너스이다. GDP 성장률은 연준의 공격적인 금리인상이후 경기 침체여부를 판단하는 중요한 지표이다. 뉴욕증시에서는 통상 2분기 이상 연속으로 GDP성장률이 마이너스를 기록하면 경기 침체로 본다. 대표적인 경기침체 판단기구인 NBER은 GDP 이외에 고용 투자 무역 산업재고등 주요 거시경제지표까지 종합 감안해 경기침체여부를 판단한다.미국 뉴욕증시 비트코인은 경기침체 여부를 주시해왔다.
제롬 파월 연준 의장은 FOMC 회의 후 기자회견에서 경제 침체 상태라고 보지 않는다고 잘라 말했다. 제롬 파월 미국 연방준비제도(Fed) 의장은 27일(현지시간) 2분기 국내총생산(GDP) 속보치를 두고 “(큰 폭으로 수정될 수 있으니) 적당히 걸러서 받아들여야 한다”고 말했다. 파월 의장은 이날까지 이틀간 열린 7월 연방공개시장위원회(FOMC) 정례회의에서 기준금리를 2.25~2.50%로 75bp(1bp=0.01%포인트) 인상하기로 결정한 직후 기자회견에서 “미국의 GDP를 집계하는 것은 매우 어렵다”면서 “GDP 속보치를 살펴보겠지만, 이것은 상당히 수정되는 경우가 많다”고 말했다. 속보치 만 보고 일희일비 하지 말아야 한다는 의미이다. 미국은 성장률을 속보치, 잠정치, 확정치로 나눠 발표한다. 미국의 1분기 성장률은 -1.6%를 기록했다.
재닛 옐런 미국 재무장관은 GDP 성장률과 관련해 국에서 경기 침체의 징후는 보이지 않는다고 밝혔다. 옐런 장관은 "일자리 창출이 일부 더뎌질 가능성이 있다"면서도 "그것이 경기 침체라고는 보지 않는다"면서 "경기 침체는 경제 전반이 취약해지는 것이며 우리는 그러한 상황을 현재 보고 있지 않다"고 강조했다. 그는 "현재 경제는 경기 침체에 처한 상황이 아니다"라면서도 "다만 우리는 성장이 느려지는 이행기에 있고, 이는 필요하고 적절한 것"이라는 기존 입장을 거듭 천명했다. 옐런 장관은 미국의 지난 1분기 국내총생산(GDP) 증가율이 연율 -1.6%로 집계된 데 이어, 2분기 역시 저조하게 나타난 상황에서도 자신감을 피력했다. 전미경제연구소(NBER)가 지금의 미국을 경기침체로 규정한다면 놀랄 것"이라며 "우리는 강력한 노동 시장을 보유하고 있다"고 단언했다. 옐런 장관은 "한 달에 40만 개 일자리를 신규 창출했다면, 이는 경기 침체가 아니다"라면서 "우리가 경기 침체를 확실히 피할 것이라고 말하는 것은 아니지만, 노동 시장을 강하게 유지하고 물가를 잡을 수 있는 길이 존재한다고 본다"고 덧붙였다.옐런 장관은 인플레이션과 관련해서는 "물가 상승이 너무나 높다"면서도 "연준이 인플레이션을 잡기 위한 대책을 수립 중이며, 그들이 성공할 것으로 기대한다"고 말했다.
EMBARGOED UNTIL RELEASE AT 8:30 a.m. EDT, Thursday, July 28, 2022
BEA 22-36
Gross Domestic Product, Second Quarter 2022 (Advance Estimate)
Real gross domestic product (GDP) decreased at an annual rate of 0.9 percent in the second quarter of 2022 (table 1), according to the "advance" estimate released by the Bureau of Economic Analysis. In the first quarter, real GDP decreased 1.6 percent.
Real GDP: Percent change from preceding quarter
The decrease in real GDP reflected decreases in private inventory investment, residential fixed investment, federal government spending, state and local government spending, and nonresidential fixed investment that were partly offset by increases in exports and personal consumption expenditures (PCE). Imports, which are a subtraction in the calculation of GDP, increased (table 2).
The decrease in private inventory investment was led by a decrease in retail trade (mainly general merchandise stores as well as motor vehicle dealers). The decrease in residential fixed investment was led by a decrease in "other" structures (specifically brokers' commissions). The decrease in federal government spending reflected a decrease in nondefense spending that was partly offset by an increase in defense spending. The decrease in nondefense spending reflected the sale of crude oil from the Strategic Petroleum Reserve, which results in a corresponding decrease in consumption expenditures. Because the oil sold by the government enters private inventories, there is no direct net effect on GDP. The decrease in state and local government spending was led by a decrease in investment in structures. The decrease in nonresidential fixed investment reflected decreases in structures and equipment that were mostly offset by an increase in intellectual property products. The increase in imports reflected an increase in services (led by travel).
The increase in exports reflected increases in both goods (led by industrial supplies and materials) and services (led by travel). The increase in PCE reflected an increase in services (led by food services and accommodations as well as health care) that was partly offset by a decrease in goods (led by food and beverages).
Real GDP decreased less in the second quarter than in the first quarter, decreasing 0.9 percent after decreasing 1.6 percent. The smaller decrease reflected an upturn in exports and a smaller decrease in federal government spending that were partly offset by larger declines in private inventory investment and state and local government spending, a slowdown in PCE, and downturns in nonresidential fixed investment and residential fixed investment. Imports decelerated.
Current‑dollar GDP increased 7.8 percent at an annual rate, or $465.1 billion, in the second quarter to a level of $24.85 trillion. In the first quarter, GDP increased 6.6 percent, or $383.9 billion (tables 1 and 3).
The price index for gross domestic purchases increased 8.2 percent in the second quarter, compared with an increase of 8.0 percent in the first quarter (table 4). The PCE price index increased 7.1 percent, the same rate as the first quarter. Excluding food and energy prices, the PCE price index increased 4.4 percent, compared with an increase of 5.2 percent.
Personal Income
Current-dollar personal income increased $353.8 billion in the second quarter, compared with an increase of $247.2 billion in the first quarter. The increase primarily reflected increases in compensation (led by private wages and salaries), proprietors' income (both nonfarm and farm), personal income receipts on assets, and rental income (table 8).
Disposable personal income increased $291.4 billion, or 6.6 percent, in the second quarter, in contrast to a decrease of $58.8 billion, or 1.3 percent, in the first quarter. Real disposable personal income decreased 0.5 percent, compared with a decrease of 7.8 percent. Personal saving was $968.4 billion in the second quarter, compared with $1.02 trillion in the first quarter. The personal saving rate—personal saving as a percentage of disposable personal income—was 5.2 percent in the second quarter, compared with 5.6 percent in the first quarter.
Source Data for the Advance Estimate
Information on the source data and key assumptions used in the advance estimate is provided in a Technical Note that is posted with the news release on BEA's website. A detailed "Key Source Data and Assumptions" file is also posted for each release. For information on updates to GDP, refer to the "Additional Information" section that follows.
Gross Domestic Product (Third Estimate), GDP by Industry, and Corporate Profits (Revised), First Quarter 2022
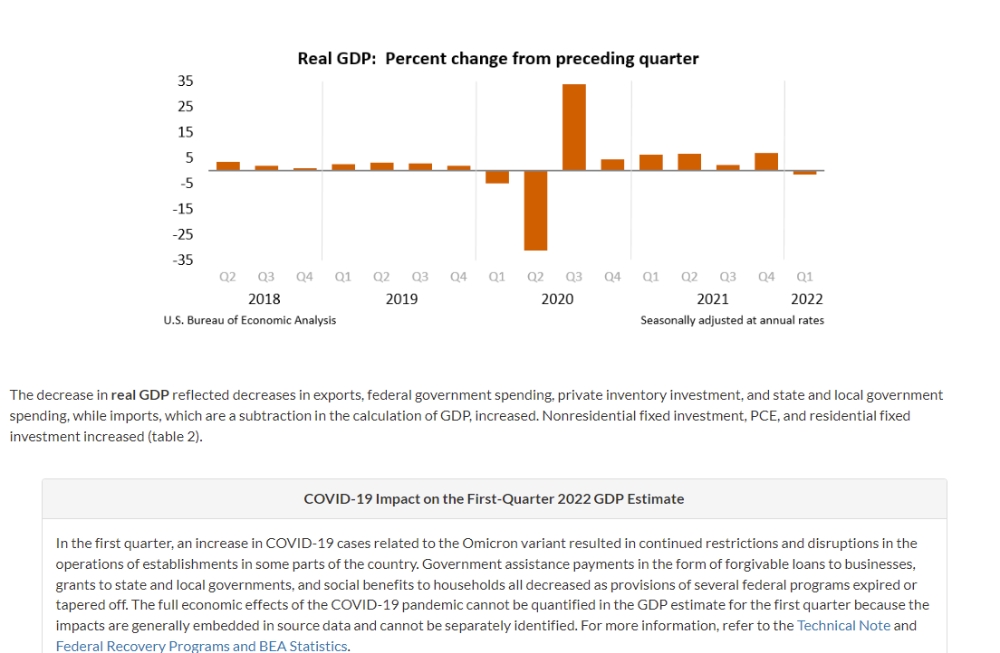
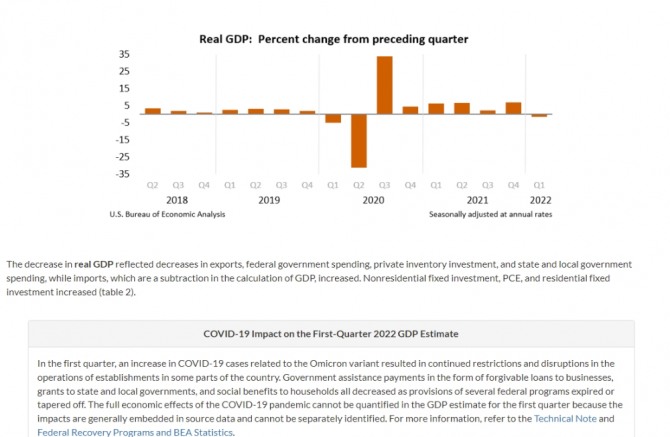
Real gross domestic product (GDP) decreased at an annual rate of 1.6 percent in the first quarter of 2022, according to the "third" estimate released by the Bureau of Economic Analysis. In the fourth quarter of 2021, real GDP increased 6.9 percent.
The "third" estimate of GDP released today is based on more complete source data than were available for the "second" estimate issued last month. In the second estimate, the decrease in real GDP was 1.5 percent. The update primarily reflects a downward revision to personal consumption expenditures (PCE) that was partly offset by an upward revision to private inventory investment (refer to "Updates to GDP").
Real GDP: Percent change from preceding quarter
The decrease in real GDP reflected decreases in exports, federal government spending, private inventory investment, and state and local government spending, while imports, which are a subtraction in the calculation of GDP, increased. Nonresidential fixed investment, PCE, and residential fixed investment increased (table 2).
COVID-19 Impact on the First-Quarter 2022 GDP Estimate
In the first quarter, an increase in COVID-19 cases related to the Omicron variant resulted in continued restrictions and disruptions in the operations of establishments in some parts of the country. Government assistance payments in the form of forgivable loans to businesses, grants to state and local governments, and social benefits to households all decreased as provisions of several federal programs expired or tapered off. The full economic effects of the COVID-19 pandemic cannot be quantified in the GDP estimate for the first quarter because the impacts are generally embedded in source data and cannot be separately identified. For more information, refer to the Technical Note and Federal Recovery Programs and BEA Statistics.
The decrease in exports reflected widespread decreases in nondurable goods. The decrease in federal government spending primarily reflected a decrease in defense spending on intermediate goods and services. The decrease in private inventory investment was led by decreases in wholesale trade (mainly motor vehicles) as well as mining, utilities, and construction (notably, utilities). The increase in imports was led by an increase in goods (notably, nonfood and nonautomotive consumer goods).
The increase in nonresidential fixed investment reflected increases in equipment and intellectual property products. The increase in PCE reflected an increase in spending on services (led by housing and utilities and "other" services) that was partly offset by a decrease in spending on goods. Within goods, widespread decreases in nondurable goods (led by groceries as well as gasoline and other energy goods) were largely offset by an increase in durable goods (led by motor vehicles and parts).
Current‑dollar GDP increased 6.6 percent (revised) at an annual rate, or $383.9 billion, in the first quarter to a level of $24.39 trillion. In the fourth quarter, GDP increased 14.5 percent, or $800.5 billion (table 1 and table 3). More information on the source data that underlie the estimates is available in the "Key Source Data and Assumptions" file on BEA's website.
The price index for gross domestic purchases increased 8.0 percent (revised) in the first quarter, compared with an increase of 7.0 percent in the fourth quarter (table 4). The PCE price index increased 7.1 percent (revised), compared with an increase of 6.4 percent. Excluding food and energy prices, the PCE price index increased 5.2 percent (revised), compared with an increase of 5.0 percent.
Personal Income
Current-dollar personal income increased $247.2 billion (revised) in the first quarter to a level of $21.26 trillion. In the fourth quarter, personal income increased $186.2 billion. The increase primarily reflected an increase in compensation that was partly offset by a decrease in government social benefits (table 8). In the first quarter, government assistance payments in the form of social benefits to households decreased as provisions of several federal programs expired or continued to taper off.
Disposable personal income decreased $58.8 billion (revised), or 1.3 percent, in the first quarter, in contrast to an increase of $72.4 billion, or 1.6 percent, in the fourth quarter. Real disposable personal income decreased 7.8 percent (revised), compared with a decrease of 4.5 percent. Personal saving was $1.02 trillion in the first quarter (revised), compared with $1.45 trillion in the fourth quarter. The personal saving rate—personal saving as a percentage of disposable personal income—was 5.6 percent (revised) in the first quarter, compared with 7.9 percent in the fourth quarter.
 이미지 확대보기
Gross Domestic Income and Corporate Profits
Real gross domestic income (GDI) increased 1.8 percent (revised) in the first quarter, compared with an increase of 6.3 percent in the fourth quarter. The average of real GDP and real GDI, a supplemental measure of U.S. economic activity that equally weights GDP and GDI, increased 0.1 percent (revised) in the first quarter, compared with an increase of 6.6 percent in the fourth quarter (table 1).
Profits from current production (corporate profits with inventory valuation and capital consumption adjustments) decreased $63.8 billion (revised) in the first quarter, in contrast to an increase of $20.4 billion in the fourth quarter (table 10).
Profits of domestic financial corporations decreased $51.1 billion (revised) in the first quarter, compared with a decrease of $1.3 billion in the fourth quarter. Profits of domestic nonfinancial corporations decreased $4.8 billion (revised), in contrast to an increase of $5.0 billion. Rest-of-the-world profits decreased $7.9 billion (revised), in contrast to an increase of $16.8 billion. In the first quarter, receipts increased $17.7 billion, and payments increased $25.6 billion.
Updates to GDP
The decrease in first-quarter real GDP was revised down 0.1 percentage point from the second estimate, reflecting downward revisions to PCE and federal government spending that were mostly offset by upward revisions to private inventory investment, nonresidential fixed investment, exports, state and local government spending, and residential fixed investment. Imports were revised up. For more information, refer to the Technical Note. For information on updates to GDP, refer to the "Additional Information" section that follows.
앞서 미국 CNBC 방송은 이코노미스트들이 2분기 GDP 성장률을 평균적으로 0%(전기 대비·연율 환산 기준)대로 보고 있다고 보도했다. 일부는 마이너스를 점쳤다. 월스트리트저널(WSJ)은 많은 이코노미스트가 마이너스 성장을 예상한다고 전했다. 애틀랜타 연방준비은행(연은)이 산출하는 'GDP 나우'는 2분기 성장률을 -1.2%로 제시했다. JP모건은 2분기 성장률 전망치를 종전 0.7%에서 1.4%로 상향 조정했다. 골드만삭스도 역시 0.4%에서 1%로 올렸다. 로이터 통신은 미국이 2분기에 무역 적자가 감소했고, 수출이 증가했으며 기업의 설비 투자가 증가해 마이너스 성장을 피할 수 있었다고 이날 보도했다. JP모건 체이스는 2분기에 미국 경제가 0.7% 성장했을 것으로 예상했다가 이를 1.4% 성장으로 조정했다. 씨티그룹도 상무부가 제시한 자료를 보면 미국 경제가 2분기에 역성장을 하지 않았을 것으로 보인다고 밝혔다.
김대호 글로벌이코노믹 연구소장 tiger8280@g-enews.com


