


;)
;)


 이미지 확대보기
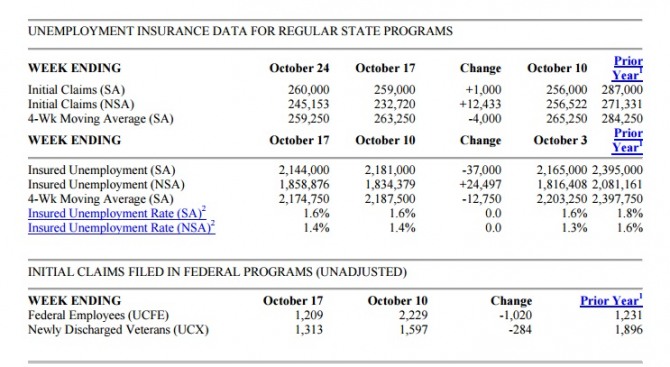
미국 노동부는 30일 지난 24일 기준의 주간 신규 실업수당 신청건수가 26만 건에 달했다고 발표했다.
이는 시장 전망치 26만5000건을 하회한 것이다.
이에따라 4주간 평균 실업수당 청구건수는 25만9250건으로 1973년 12월 이후 최저를 기록했다.
신규 실업수당 신청이 감소한다는 것은 새로 실업자로 전락하는 사람이 줄어든다는 것을 의미한다.
연준은 고용지표를 금리인상의 가장 중요한 근거로 삼고 있다.
고용사정이 호전되면 바로 금리를 올리겠다고 선언해 놓고 있다.
이러한 마당에 신규 실업 수당 신청건수가 43년만에 최저로 나타남에 따라 연준으로서는 금리를 올릴 수 있는 또 하나의 좋은 명분을 얻은 셈이다.
물론 신규 실업수당 신청이 고용 사정을 모두 대변하는 것은 아니다.
고용지표에는 실업률, 고용률, 신규 일자리수, 신규 구인 수 등 여러 지표가 있다.
이들 지표의 움직임도 물론 변수다.
그중에서도 신규실업수당 신청건수가 갖는 의미는 자못 크다.
실업수당 신청의 기본 요건은 해고이다.
본인이 자발적으로 그만두면 실업수당을 청구할 수 없다.
해고당한 실업자의 고통은 자발적으로 그만 둔 사람의 고통보다 훨씬 더 클 수 밖에 없다.
그런 만큼 신규실업 신청건수가 갖는 의미가 중차대한 것이다.
신규실업 신청건수가 앞으로도 계속 43년 최저수준인 26만이하에서 맴돌 경우 12월 금리인상 가능성은 상당히 높아진다.
다음은 미국 노동부 발표 신규실업 수당 신청 건수 동향 보도자료 전문
News Release
UNEMPLOYMENT INSURANCE WEEKLY CLAIMS SEASONALLY ADJUSTED DATA
In the week ending October 24, the advance figure for seasonally adjusted initial claims was 260,000, an increase of
1,000 from the previous week's unrevised level of 259,000. The 4-week moving average was 259,250, a decrease of
4,000 from the previous week's unrevised average of 263,250. This is the lowest level for this average since December
15, 1973 when it was 256,750.
There were no special factors impacting this week's initial claims.
The advance seasonally adjusted insured unemployment rate was 1.6 percent for the week ending October 17,
unchanged from the previous week's unrevised rate. The advance number for seasonally adjusted insured
unemployment during the week ending October 17 was 2,144,000, a decrease of 37,000 from the previous week's
revised level. This is the lowest level for insured unemployment since November 4, 2000 when it was 2,110,000. The
previous week's level was revised up 11,000 from 2,170,000 to 2,181,000. The 4-week moving average was 2,174,750, a
decrease of 12,750 from the previous week's revised average. This is the lowest level for this average since November
18, 2000 when it was 2,169,000. The previous week's average was revised up by 3,000 from 2,184,500 to 2,187,500.
UNADJUSTED DATA
 이미지 확대보기
The advance number of actual initial claims under state programs, unadjusted, totaled 245,153 in the week ending
October 24, an increase of 12,433 (or 5.3 percent) from the previous week. The seasonal factors had expected an increase
of 11,649 (or 5.0 percent) from the previous week. There were 271,331 initial claims in the comparable week in 2014.
The advance unadjusted insured unemployment rate was 1.4 percent during the week ending October 17, unchanged
from the prior week. The advance unadjusted number for persons claiming UI benefits in state programs totaled
1,858,876, an increase of 24,497 (or 1.3 percent) from the preceding week. The seasonal factors had expected an increase
of 56,711 (or 3.1 percent) from the previous week. A year earlier the rate was 1.6 percent and the volume was 2,081,161.
The total number of people claiming benefits in all programs for the week ending October 10 was 1,880,908, an increase
of 18,694 from the previous week. There were 2,061,815 persons claiming benefits in all programs in the comparable
week in 2014.
No state was triggered "on" the Extended Benefits program during the week ending October 10.
Initial claims for UI benefits filed by former Federal civilian employees totaled 1,209 in the week ending October 17, a
decrease of 1,020 from the prior week. There were 1,313 initial claims filed by newly discharged veterans, a decrease of
284 from the preceding week.
There were 13,171 former Federal civilian employees claiming UI benefits for the week ending October 10, an increase
of 1,206 from the previous week. Newly discharged veterans claiming benefits totaled 14,976, a decrease of 2,050 from
the prior week.
The highest insured unemployment rates in the week ending October 10 were in Alaska (5.4), Puerto Rico (3.3), the
Virgin Islands (2.8), New Jersey (2.3), California (2.0), Connecticut (2.0), Nevada (2.0), Pennsylvania (2.0), West
Virginia (1.9), and Illinois (1.7).
The largest increases in initial claims for the week ending October 17 were in South Carolina (+2,156), Michigan
(+2,117), Minnesota (+525), Vermont (+103), and Wyoming (+69), while the largest decreases were in Pennsylvania (-
3,583), Texas (-2,893), Georgia (-2,524), New York (-2,174), and Florida (-1,801).
STATE Advance Prior Wk Change Advance Prior Wk Change
Alabama 2,581 2,705 -124 19,781 21,016 -1,235
Alaska 1,891 1,490 401 9,051 16,983 -7,932
Arizona 3,690 3,753 -63 27,810 30,606 -2,796
Arkansas 2,513 2,555 -42 17,437 17,576 -139
California 46,226 43,592 2,634 336,056 307,831 28,225
Colorado 2,713 2,654 59 26,851 23,539 3,312
Connecticut 2,880 2,419 461 33,512 32,227 1,285
Delaware 629 742 -113 5,693 5,403 290
District of Columbia 674 378 296 7,864 8,133 -269
Florida 7,676 7,848 -172 52,042 58,477 -6,435
Georgia 6,506 6,042 464 33,312 35,002 -1,690
Hawaii 1,146 1,206 -60 6,716 6,726 -10
Idaho 1,492 770 722 5,178 4,967 211
Illinois 10,496 9,172 1,324 98,953 99,314 -361
Indiana 3,620 3,048 572 19,883 19,678 205
Iowa 2,635 2,102 533 16,694 15,799 895
Kansas 1,952 1,883 69 12,628 10,948 1,680
Kentucky 2,381 2,601 -220 18,267 19,210 -943
Louisiana 2,154 2,338 -184 21,827 22,824 -997
Maine 965 682 283 4,274 4,294 -20
Maryland 3,537 3,658 -121 31,678 34,586 -2,908
Massachusetts 5,503 4,737 766 54,832 54,269 563
Michigan 6,516 9,279 -2,763 44,320 45,363 -1,043
Minnesota 3,397 3,764 -367 31,049 28,041 3,008
Mississippi 1,594 1,611 -17 10,522 11,569 -1,047
Missouri 4,017 4,226 -209 24,834 26,419 -1,585
Montana 1,287 1,239 48 5,715 5,642 73
Nebraska 860 691 169 4,945 4,714 231
Nevada 2,772 2,374 398 21,861 23,753 -1,892
New Hampshire 534 547 -13 3,831 4,055 -224
New Jersey 8,758 7,573 1,185 89,378 86,275 3,103
New Mexico 1,100 1,071 29 10,924 11,193 -269
New York 17,163 15,083 2,080 138,819 134,862 3,957
North Carolina 3,990 3,702 288 25,538 27,498 -1,960
North Dakota 664 375 289 4,917 2,304 2,613
Ohio 7,221 6,349 872 49,005 48,393 612
Oklahoma 2,086 2,012 74 20,571 20,786 -215
Oregon 4,108 4,093 15 27,292 27,269 23
Pennsylvania 15,814 14,444 1,370 115,853 113,587 2,266
Puerto Rico 1,816 1,595 221 27,956 29,058 -1,102
Rhode Island 878 746 132 6,999 6,877 122
South Carolina 4,461 5,714 -1,253 16,624 16,920 -296
South Dakota 217 208 9 971 975 -4
Tennessee 3,215 3,507 -292 21,632 22,363 -731
Texas 16,516 16,217 299 162,784 159,631 3,153
Utah 1,354 1,234 120 7,929 8,449 -520
Vermont 594 553 41 3,012 2,757 255
Virgin Islands 21 40 -19 1,192 1,046 146
Virginia 3,590 3,200 390 26,455 24,976 1,479
Washington 8,290 7,484 806 45,781 43,312 2,469
West Virginia 1,434 1,145 289 13,537 12,699 838
Wisconsin 6,237 5,737 500 30,442 30,147 295
Wyoming 789 532 257 3,849 4,038 -189
US Total 245,153 232,720 12,433 1,858,876 1,834,379 24,497
October 18, 2014 287 13 285.50 2,395 12 2,397.75 1.8
October 25, 2014 287 0 284.25 2,365 -30 2,388.00 1.8
November 1, 2014 283 -4 282.75 2,408 43 2,387.75 1.8
November 8, 2014 289 6 286.50 2,352 -56 2,380.00 1.8
November 15, 2014 292 3 287.75 2,339 -13 2,366.00 1.8
November 22, 2014 303 11 291.75 2,383 44 2,370.50 1.8
November 29, 2014 296 -7 295.00 2,469 86 2,385.75 1.9
December 6, 2014 289 -7 295.00 2,388 -81 2,394.75 1.8
December 13, 2014 289 0 294.25 2,377 -11 2,404.25 1.8
December 20, 2014 280 -9 288.50 2,366 -11 2,400.00 1.8
December 27, 2014 293 13 287.75 2,431 65 2,390.50 1.8
January 3, 2015 295 2 289.25 2,415 -16 2,397.25 1.8
January 10, 2015 304 9 293.00 2,418 3 2,407.50 1.8
January 17, 2015 301 -3 298.25 2,376 -42 2,410.00 1.8
January 24, 2015 267 -34 291.75 2,386 10 2,398.75 1.8
January 31, 2015 284 17 289.00 2,346 -40 2,381.50 1.8
February 7, 2015 302 18 288.50 2,402 56 2,377.50 1.8
February 14, 2015 285 -17 284.50 2,369 -33 2,375.75 1.8
February 21, 2015 308 23 294.75 2,405 36 2,380.50 1.8
February 28, 2015 327 19 305.50 2,414 9 2,397.50 1.8
March 7, 2015 293 -34 303.25 2,399 -15 2,396.75 1.8
March 14, 2015 293 0 305.25 2,413 14 2,407.75 1.8
March 21, 2015 288 -5 300.25 2,327 -86 2,388.25 1.7
March 28, 2015 267 -21 285.25 2,308 -19 2,361.75 1.7
April 4, 2015 282 15 282.50 2,275 -33 2,330.75 1.7
April 11, 2015 295 13 283.00 2,327 52 2,309.25 1.7
April 18, 2015 296 1 285.00 2,256 -71 2,291.50 1.7
April 25, 2015 262 -34 283.75 2,229 -27 2,271.75 1.7
May 2, 2015 265 3 279.50 2,223 -6 2,258.75 1.7
May 9, 2015 264 -1 271.75 2,212 -11 2,230.00 1.6
May 16, 2015 275 11 266.50 2,226 14 2,222.50 1.7
May 23, 2015 284 9 272.00 2,204 -22 2,216.25 1.6
May 30, 2015 277 -7 275.00 2,272 68 2,228.50 1.7
June 6, 2015 279 2 278.75 2,225 -47 2,231.75 1.7
June 13, 2015 268 -11 277.00 2,249 24 2,237.50 1.7
June 20, 2015 271 3 273.75 2,265 16 2,252.75 1.7
June 27, 2015 282 11 275.00 2,327 62 2,266.50 1.7
July 4, 2015 296 14 279.25 2,216 -111 2,264.25 1.6
July 11, 2015 281 -15 282.50 2,216 0 2,256.00 1.6
July 18, 2015 255 -26 278.50 2,270 54 2,257.25 1.7
July 25, 2015 267 12 274.75 2,258 -12 2,240.00 1.7
August 1, 2015 269 2 268.00 2,278 20 2,255.50 1.7
August 8, 2015 273 4 266.00 2,256 -22 2,265.50 1.7
August 15, 2015 277 4 271.50 2,266 10 2,264.50 1.7
August 22, 2015 270 -7 272.25 2,259 -7 2,264.75 1.7
August 29, 2015 281 11 275.25 2,263 4 2,261.00 1.7
September 5, 2015 275 -6 275.75 2,243 -20 2,257.75 1.7
September 12, 2015 264 -11 272.50 2,244 1 2,252.25 1.7
September 19, 2015 267 3 271.75 2,195 -49 2,236.25 1.6
September 26, 2015 276 9 270.50 2,209 14 2,222.75 1.6
October 3, 2015 262 -14 267.25 2,165 -44 2,203.25 1.6
October 10, 2015 256 -6 265.25 2,181 16 2,187.50 1.6
October 17, 2015 259 3 263.25 2,144 -37 2,174.75 1.6
October 24, 2015 260 1 259.25
Alabama 2705 -752 -442 7 21 21016 1.2 196 -3266 103 185 21304
Alaska 1490 -220 61 10 4 16983 5.4 9300 7644 231 87 17301
Arizona 3753 -594 -546 30 12 30606 1.2 -499 -3549 151 173 30930
Arkansas 2555 -416 -20 7 2 17576 1.5 -214 -1831 114 165 17855
California 43592 -706 -5833 201 211 307831 2.0 -5491 -31381 2308 3251 313390
Colorado 2654 -368 -98 29 51 23539 1.0 -841 -2156 184 668 24391
Connecticut 2419 -886 -646 3 13 32227 2.0 -28 -5584 73 150 32450
Delaware 742 -86 50 1 2 5403 1.3 142 -659 19 25 5447
District of Columbia 378 -73 -39 8 1 8133 1.5 113 -1187 339 16 8488
Florida 7848 -1801 -4307 32 85 58477 0.8 258 -24139 213 410 59100
Georgia 6042 -2524 -654 59 61 35002 0.9 -2030 -6920 512 589 36103
Hawaii 1206 40 -228 3 15 6726 1.1 242 -2066 106 175 7007
Idaho 770 -515 77 8 2 4967 0.8 -664 -2080 35 17 5019
Illinois 9172 -1374 -512 9 22 99314 1.7 2739 -5840 394 482 100190
Indiana 3048 -597 -1169 12 14 19678 0.7 -522 -3757 125 123 19926
Iowa 2102 -152 -111 5 12 15799 1.1 -392 -697 52 88 15939
Kansas 1883 53 -119 3 10 10948 0.8 178 -2879 71 144 11163
Kentucky 2601 -106 -429 24 10 19210 1.1 639 -2167 357 292 19859
Louisiana 2338 -297 314 10 14 22824 1.2 -134 3705 38 72 22934
Maine 682 28 -176 2 1 4294 0.7 -207 -1721 26 25 4345
Maryland 3658 -502 -658 23 8 34586 1.4 94 -9095 375 283 35244
Massachusetts 4737 -365 -698 30 16 54269 1.6 -2024 -10238 427 316 55012
Michigan 9279 2117 -2002 35 29 45363 1.1 335 -9630 113 261 45737
Minnesota 3764 525 514 15 7 28041 1.0 -266 -1399 87 184 28312
Mississippi 1611 -207 -195 7 7 11569 1.1 -162 -3647 73 59 11701
Missouri 4226 -441 -879 38 12 26419 1.0 428 -5475 954 167 27540
Montana 1239 -155 109 31 6 5642 1.3 480 -9 56 58 5756
Nebraska 691 -139 -294 2 3 4714 0.5 -442 -1187 34 31 4779
Nevada 2374 -685 -1067 7 3 23753 2.0 206 -1364 93 175 24021
New Hampshire 547 -17 -145 2 0 4055 0.7 -22 -1257 5 10 4070
New Jersey 7573 -850 -928 18 26 86275 2.3 1383 -15193 312 519 87106
New Mexico 1071 -243 30 29 6 11193 1.4 11 -834 147 91 11431
New York 15083 -2174 -1296 91 48 134862 1.5 -28 -18965 837 857 136556
North Carolina 3702 -312 -1419 9 44 27498 0.7 -488 -16079 123 399 28020
North Dakota 375 -48 105 1 0 2304 0.5 25 938 7 6 2317
Ohio 6349 -207 -1224 13 34 48393 0.9 -662 -4100 245 442 49080
Oklahoma 2012 -110 419 7 15 20786 1.3 -15 6192 74 160 21020
Oregon 4093 -990 -550 60 27 27269 1.6 900 -3096 244 309 27822
Pennsylvania 14444 -3583 -730 110 63 113587 2.0 4067 -542 911 638 115136
Puerto Rico 1595 -1085 -375 1 7 29058 3.3 848 -2707 137 216 29411
Rhode Island 746 -279 -198 0 1 6877 1.5 -6 -1178 24 58 6959
South Carolina 5714 2156 2643 28 20 16920 0.9 2036 57 55 146 17121
South Dakota 208 -26 -20 3 3 975 0.2 -11 -116 24 0 999
Tennessee 3507 -152 -780 29 26 22363 0.8 115 -4521 157 206 22726
Texas 16217 -2893 1840 56 188 159631 1.4 7706 34390 1080 328 161039
Utah 1234 -218 -44 20 6 8449 0.7 243 -719 296 55 8800
Vermont 553 103 13 4 1 2757 0.9 124 -511 15 12 2784
Virgin Islands 40 -20 7 0 7 1046 2.8 -56 -48 4 6 1056
Virginia 3200 -540 -358 14 36 24976 0.7 -154 -5439 306 629 25911
Washington 7484 -304 309 46 82 43312 1.4 33 -1911 323 1024 44659
West Virginia 1145 -540 -34 0 5 12699 1.9 -4 1677 75 83 12857
Wisconsin 5737 -341 -852 15 10 30147 1.1 396 -7513 88 75 30310
Wyoming 532 69 138 2 4 4038 1.5 96 1718 19 36 4093
Totals 232720 -23802 -23446 1209 1313 1834379 1.4 17971 -172331 13171 14976 1862526
 이미지 확대보기
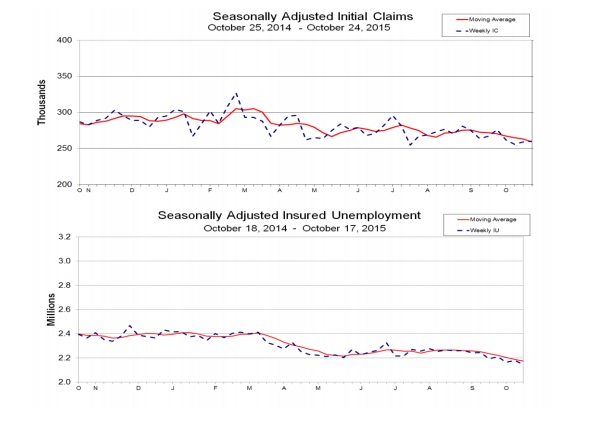
A. Initial Claims
An initial claim is a claim filed by an unemployed individual after a separation from an employer. The claimant requests
a determination of basic eligibility for the UI program. When an initial claim is filed with a state, certain programmatic
activities take place and these result in activity counts including the count of initial claims. The count of U.S. initial
claims for unemployment insurance is a leading economic indicator because it is an indication of emerging labor market
conditions in the country. However, these are weekly administrative data which are difficult to seasonally adjust, making
the series subject to some volatility.
B. Continued Weeks Claimed
A person who has already filed an initial claim and who has experienced a week of unemployment then files a continued
claim to claim benefits for that week of unemployment. Continued claims are also referred to as insured unemployment.
The count of U.S. continued weeks claimed is also a good indicator of labor market conditions. Continued claims reflect
the current number of insured unemployed workers filing for UI benefits in the nation. While continued claims are not a
leading indicator (they roughly coincide with economic cycles at their peaks and lag at cycle troughs), they provide
confirming evidence of the direction of the U.S. economy.
C. Seasonal Adjustments and Annual Revisions
Over the course of a year, the weekly changes in the levels of initial claims and continued claims undergo regularly
occurring fluctuations. These fluctuations may result from seasonal changes in weather, major holidays, the opening and
closing of schools, or other similar events. Because these seasonal events follow a more or less regular pattern each year,
their influence on the level of a series can be tempered by adjusting for regular seasonal variation. These adjustments
make trend and cycle developments easier to spot.
At the beginning of each calendar year, the Bureau of Labor Statistics provides the Employment and Training
Administration (ETA) with a set of seasonal factors to apply to the unadjusted data during that year. Concurrent with the
implementation and release of the new seasonal factors, ETA incorporates revisions to the UI claims historical series
caused by updates to the unadjusted data.
김대호 경제연구소장 겸 대기자 tiger8280@


